Planforge Blog
  • Software
  • Solutions
  • Pricing
  • Experience
  • Resources
  • en
  • de
 
  • en
  • de
  • Software
  • Solutions
  • Pricing
  • Experience
  • Resources
Back to menu

Software

  • Project Management From project start to completion
  • Program Management Control complex programs easily
  • Portfolio Management Analyze projects and programs
  • Resource Management Plan capacities optimally
  • Strategic Management Implement visions successfully
  • Enterprise Agile Planning All ARTs and PIs in one tool

Software Overview

Back to menu

Solutions

  • Project Management Office All tools for your PMO
  • Lean Project Management Making daily project work easier
  • New Product Development Faster Time-To-Market

All Solutions

Integrations

Jira Confluence SAP API

All Integrations

Back to menu
Back to menu

Experience

  • References
  • Planforge is a Gartner Leader
  • Success Stories
  • Discover Planforge in a demo

Become a part of +25,000 users

Back to menu

About us

  • About the company
  • News from Planforge
  • Press Information

Learn more about Planforge

Resources

Getting Started Guide Downloads FAQ

To the PM blog

April 25, 2019

Scheduling with Gantt Chart: Always Following the Bar

The Gantt chart or bar chart according to Gantt is one of the most popular methods for scheduling projects. Learn about what it can do and how it is created at a glance.

Gerald Aquila

Gerald Aquila

463 words • 4 minutes

Share on: Auf LinkedIn teilen Tweet Auf Facebook teilen

The Gantt Chart explained


The method was named after the American engineer and management consultant Henry Gantt. He further developed the idea of Karol Adamiecki from Poland and helped to make a breakthrough of the method into the West.

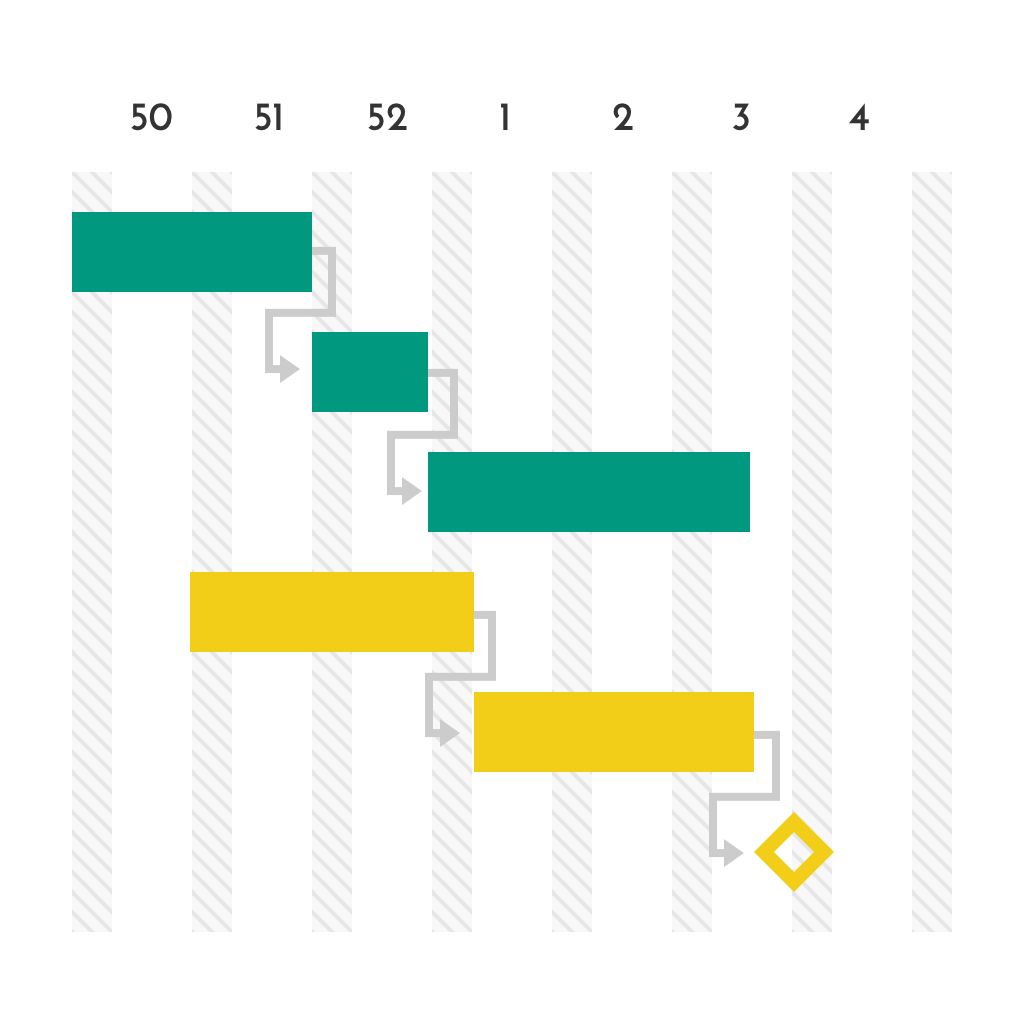
The key characteristic of the Gantt Chart is its visual logic:


All work steps within a project are represented as horizontal bars

Thus, both their probable duration and dependencies on other activities become apparent.

Specific events, e.g. milestones or intermediate objectives are marked by special icons.

The-Gantt-Chart-Software-by-Planforge

As it is immediately apparent when individual work packages have to be completed and which deadlines are binding, the project schedule can be optimized right from the start.

Creating a Gantt Chart Correctly

  1. All activities of the project are entered in the first column of the table.
  2. A horizontal time axis indicates the entire project duration. This can be divided into days, weeks or months. These time units correspond to structuring of the columns.

Now the appropriate time bar for the respective task is entered in each line. Sequences, overlaps and gaps (buffers) become immediately visible. For work package dependencies, there are established icons that indicate the nature of the relationship (e.g., "end-to-end": once package A is completed, package B can begin.) Also, project resources are often plotted as bars to map where bottlenecks are possible.

The schedule is based on the start date or the end date. Once this is set, further dates for milestones and individual activities can be fixed.

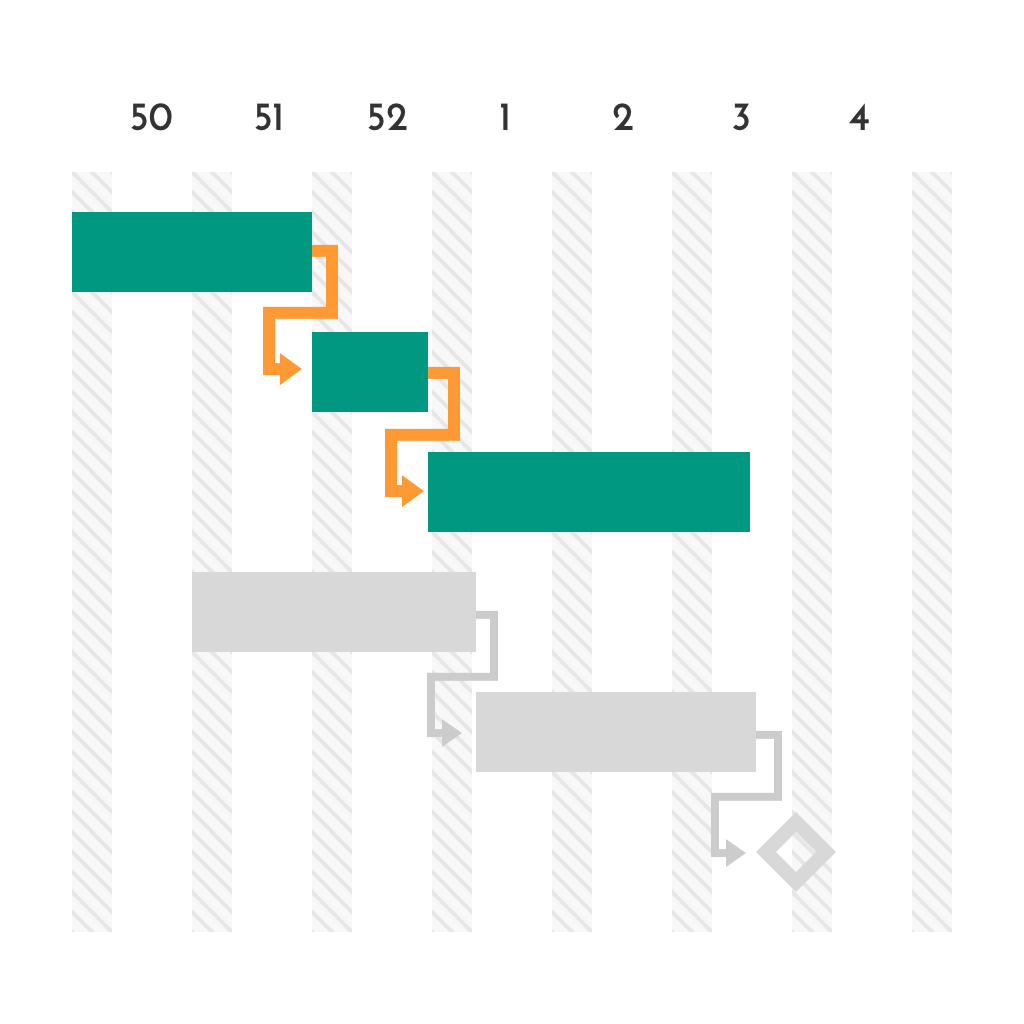
The Critical Path of Gantt

Some work steps are more flexible in terms of time, and can be pushed if necessary. On the basis of the critical path one can recognize those processes whose timely implementation is obligatory. A temporal shift of events along the critical path would have direct impact on the achievement of the target date. The marker cannot prevent delays, but it can indicate them early so that, for example, resources can be redistributed.

The-Gantt-Chart-Critical-Path-Software-by-Planforge

Update January 26, 2021:
I recently came across an interesting Example of how to create a Gantt Chart that you might find helpful.

Advantages and Disadvantages of a Gantt Chart

Advantages

  • It shows a comprehensive picture of all project tasks including dependencies.
  • It helps to set realistic timeframes.
  • It is easy to understand for everyone involved.
  • Processes are structured from the beginning and considered as a whole.

Disadvantages

  • Required resources are displayed inaccurately: The size of the bars does not indicate how extensive or complex the respective activity is.

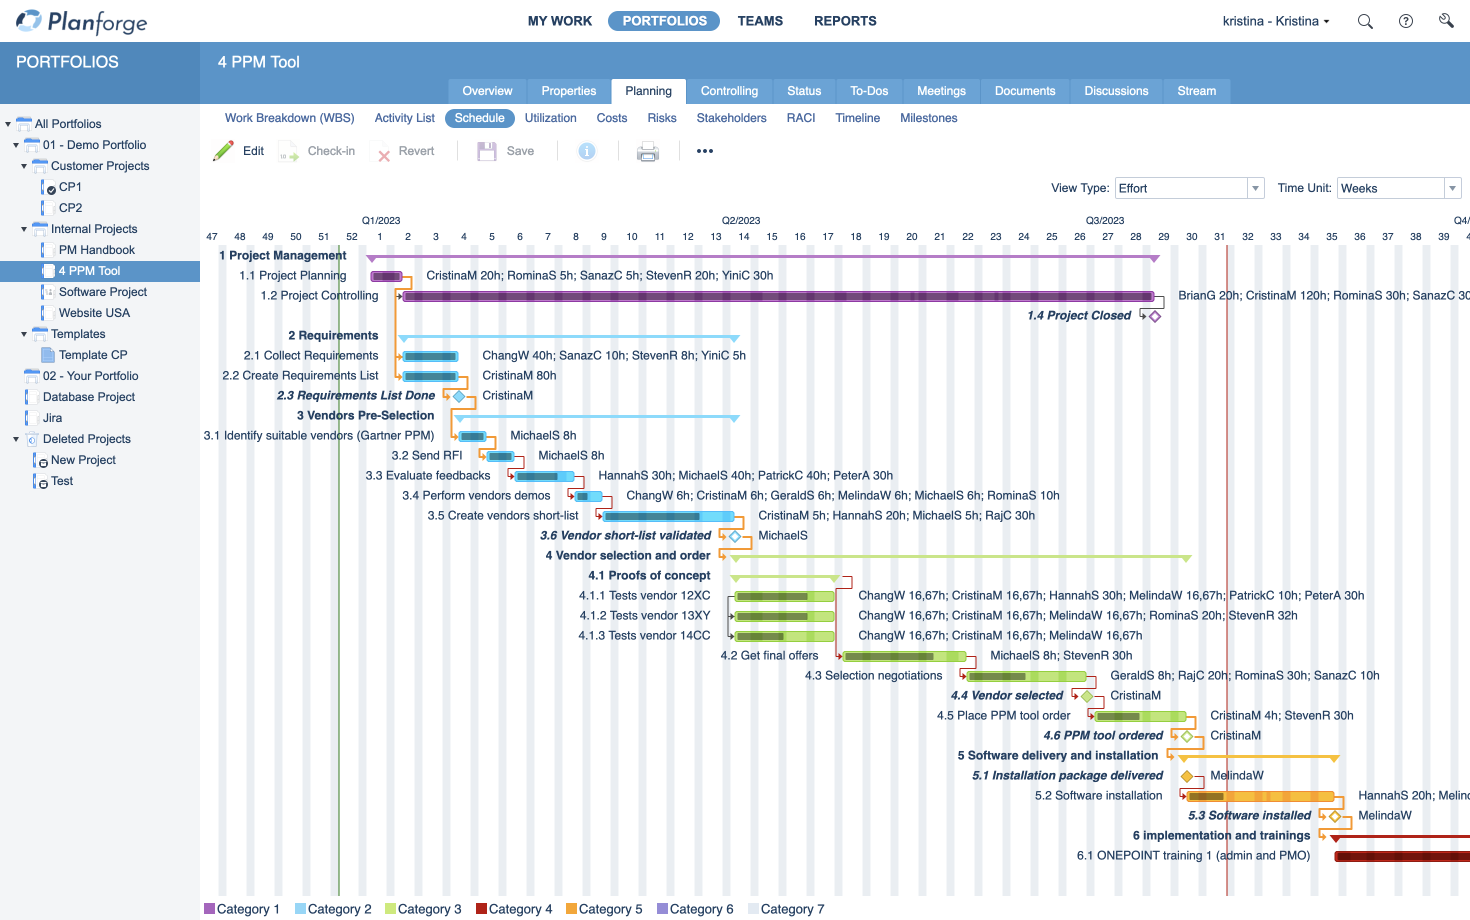
In conclusion, the following figure shows how the Gantt Chart is displayed in a project management tool:

Project-Management-Planning-gantt-Schedule-Software-by-Planforge

Relevant Project Management Terms

Progress Report

See Project Progress Report.

Planning / Project Planning

Project planning is one of the most important components of project management. It is part of the four phases of traditional project management (initiation, planning, control, completion) and also occupies an important but more flexible place in agile project management.

Project Activity

See Activity

Resources

In project management, resources describe the personnel and material resources required and used to complete a project.

Schedule

The schedule maps the chronological sequence of work packages including start and end dates, as well as milestones and buffer times. The schedule can be planned with a forward or backward calculation.

Work Package

A work package is defined as a task that must be completed at a certain point in time with a previously defined effort and result. Work packages are important elements of the work breakdown structure and serve as the basis for scheduling, resource and cost planning.

Glossary

Planforge Blog
Software
  • Project Management
  • Portfolio Management
  • Program Management
  • Resource Management
  • Strategic Management
  • Enterprise Agile Planning
Solutions
  • Project Management Office
  • Lean Project Management
  • New Product Development
Integrations
  • API
  • Jira
  • Confluence
  • SAP
Experience
  • References
  • Success Stories
All about Planforge
  • Company
  • Partners
  • Jobs
  • News
  • Press
ONEPOINT Projects GmbH

Dietrich-Keller-Strasse 24/6
8074 Raaba-Grambach (Graz), Austria
+43 (316) 267 267 0

ONEPOINT Germany

Mühlenstrasse 13
85778 Haimhausen (Munich), Germany
+49 (81) 33 444 777

ONEPOINT USA

325 W. Washington St. #2225
San Diego, CA 92103, USA
+1 (619) 985 0673

© 2023 ONEPOINT Projects GmbH   info@planforge.io   Imprint   Privacy

li fb o yt tw