Planforge Blog
  • Software
  • Solutions
  • Pricing
  • Experience
  • Resources
  • en
  • de
 
  • en
  • de
  • Software
  • Solutions
  • Pricing
  • Experience
  • Resources
Back to menu

Software

  • Project Management From project start to completion
  • Program Management Control complex programs easily
  • Portfolio Management Analyze projects and programs
  • Resource Management Plan capacities optimally
  • Strategic Management Implement visions successfully
  • Enterprise Agile Planning All ARTs and PIs in one tool

Software Overview

Back to menu

Solutions

  • Project Management Office All tools for your PMO
  • Lean Project Management Making daily project work easier
  • New Product Development Faster Time-To-Market

All Solutions

Integrations

Jira Confluence SAP API

All Integrations

Back to menu
Back to menu

Experience

  • References
  • Planforge is a Gartner Leader
  • Success Stories
  • Discover Planforge in a demo

Become a part of +25,000 users

Back to menu

About us

  • About the company
  • News from Planforge
  • Press Information

Learn more about Planforge

Resources

Getting Started Guide Downloads FAQ

To the PM blog

April 01, 2023

Gantt Chart

Gantt Chart: Definition

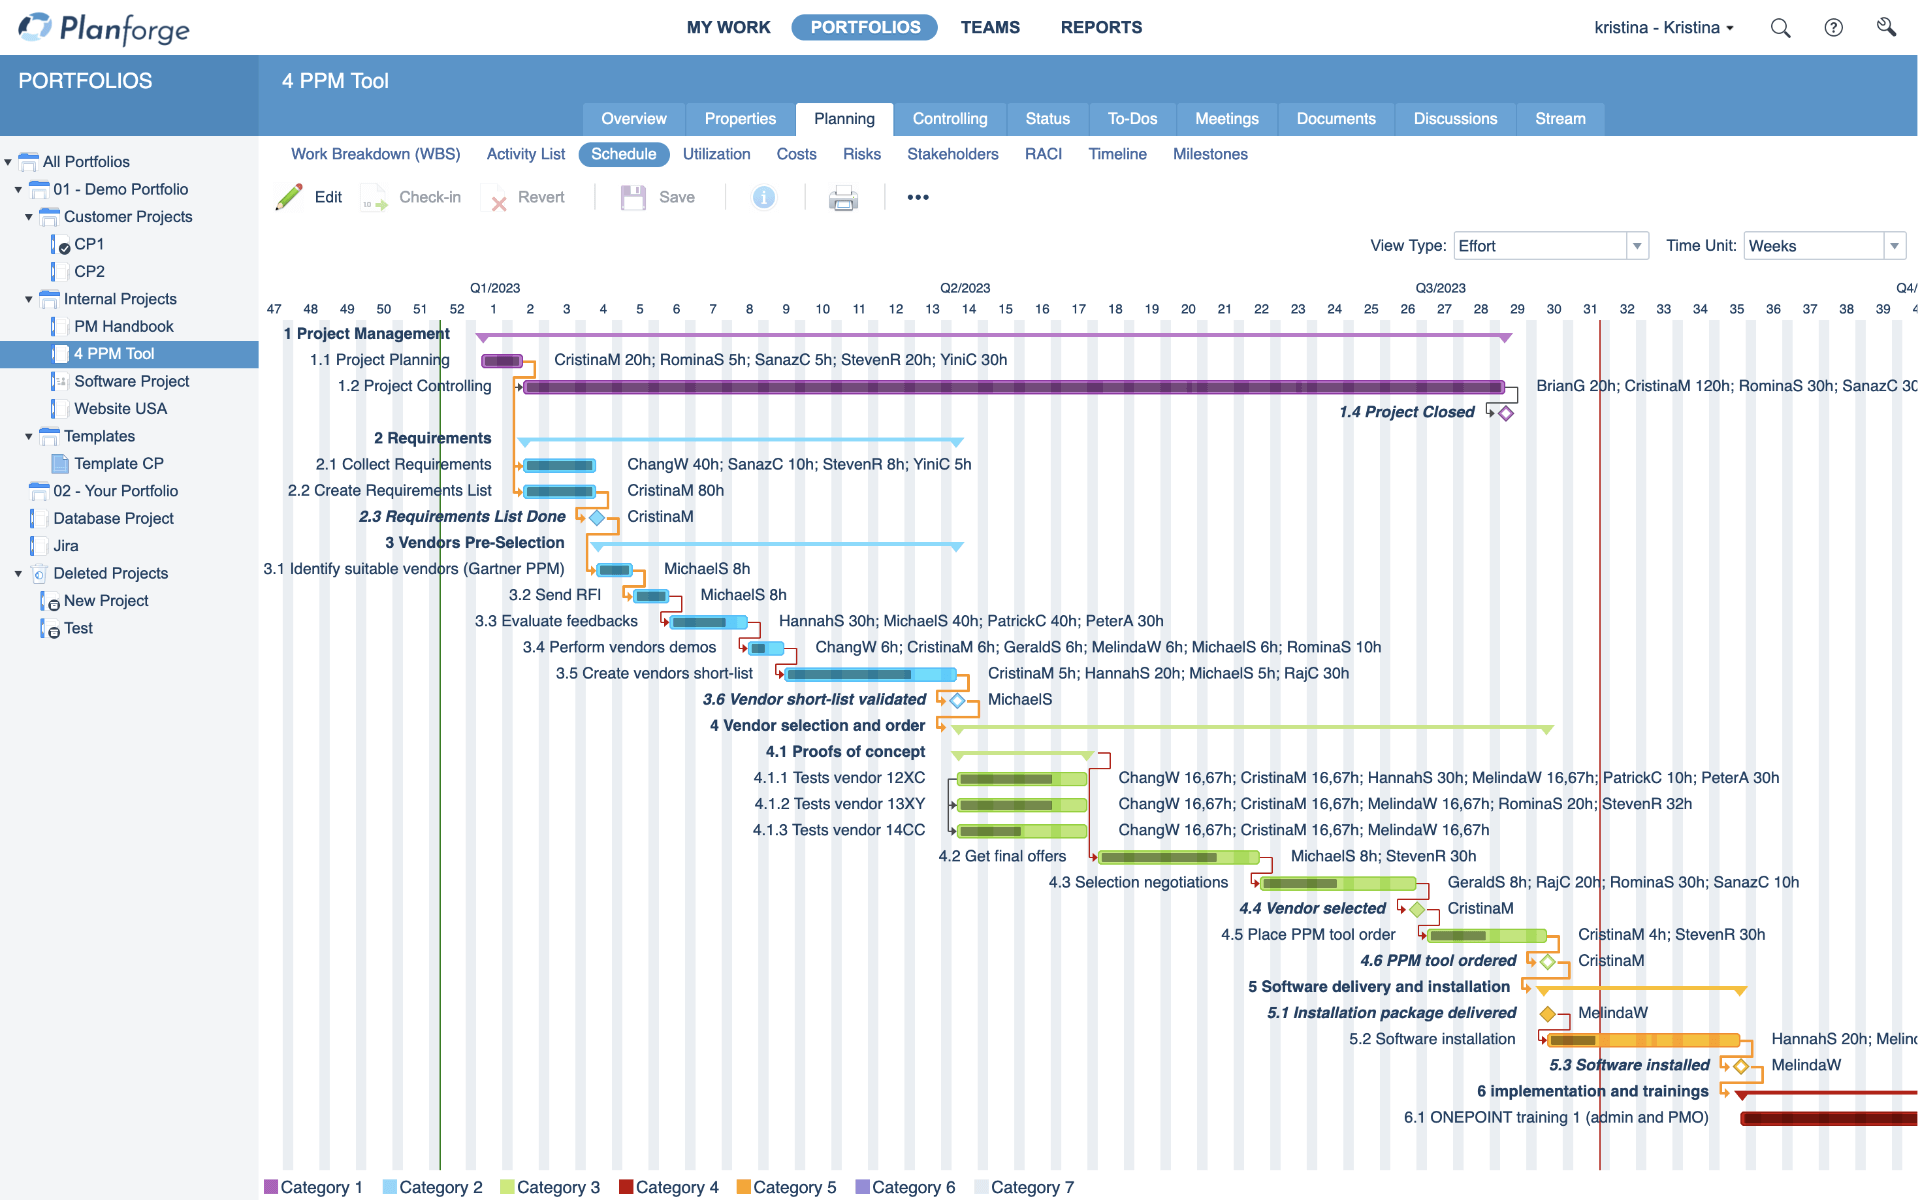
The Gantt chart (named after Henry Gantt) displays the project schedule. It visualizes project activities' start and finish dates, dependencies, the critical path, and sometimes even milestones.

How to Use a Gantt Chart

In a Gantt chart, all work steps within a project are displayed as horizontal bars along a time axis. Thus, all activities' duration, overlaps, and dependencies are visible at a glance. Gantt scheduling is one of the most common methods in project management.

  • The horizontal bars display the project timeline with activities and their start and end dates, duration, and task sequences.
  • The connecting lines represent the critical path of the Gantt chart.
  • The horizontal time axis indicates the project duration. It can be divided into days, weeks, or months. These time units correspond to the structuring of the columns.

The Gantt Chart in Project Management

The following figure illustrates an example of a Gantt chart in project management software:

Gantt Chart Software by Planforge

Gantt Chart: Advantages in Project Management

  • Can be used to manage all sizes of projects
  • Visualizes the activity timeline for all stakeholders
  • Uncovers the critical path and detects time delays or bottlenecks
  • Identifies task dependencies
Gerald Aquila

Gerald Aquila

210 words • 2 minutes

Share on: Auf LinkedIn teilen Tweet Auf Facebook teilen

Related Articles

Scheduling with Gantt Chart: Always Following the Bar

The Gantt chart or bar chart according to Gantt is one of the most popular methods for scheduling projects. What it can do and how it is created can be found here.

Read more

Read more

Planforge Blog
Software
  • Project Management
  • Portfolio Management
  • Program Management
  • Resource Management
  • Strategic Management
  • Enterprise Agile Planning
Solutions
  • Project Management Office
  • Lean Project Management
  • New Product Development
Integrations
  • API
  • Jira
  • Confluence
  • SAP
Experience
  • References
  • Success Stories
All about Planforge
  • Company
  • Partners
  • Jobs
  • News
  • Press
ONEPOINT Projects GmbH

Dietrich-Keller-Strasse 24/6
8074 Raaba-Grambach (Graz), Austria
+43 (316) 267 267 0

ONEPOINT Germany

Mühlenstrasse 13
85778 Haimhausen (Munich), Germany
+49 (81) 33 444 777

ONEPOINT USA

325 W. Washington St. #2225
San Diego, CA 92103, USA
+1 (619) 985 0673

© 2023 ONEPOINT Projects GmbH   info@planforge.io   Imprint   Privacy

li fb o yt tw