Planforge Blog
  • Software
  • Solutions
  • Pricing
  • Experience
  • Resources
  • en
  • de
 
  • en
  • de
  • Software
  • Solutions
  • Pricing
  • Experience
  • Resources
Back to menu

Software

  • Project Management From project start to completion
  • Program Management Control complex programs easily
  • Portfolio Management Analyze projects and programs
  • Resource Management Plan capacities optimally
  • Strategic Management Implement visions successfully
  • Enterprise Agile Planning All ARTs and PIs in one tool

Software Overview

Back to menu

Solutions

  • Project Management Office All tools for your PMO
  • Lean Project Management Making daily project work easier
  • New Product Development Faster Time-To-Market

All Solutions

Integrations

Jira Confluence SAP API

All Integrations

Back to menu
Back to menu

Experience

  • References
  • Planforge is a Gartner Leader
  • Success Stories
  • Discover Planforge in a demo

Become a part of +25,000 users

Back to menu

About us

  • About the company
  • News from Planforge
  • Press Information

Learn more about Planforge

Resources

Getting Started Guide Downloads FAQ

To the PM blog

March 24, 2023

Key Performance Indicators

What is a KPI?

Key performance indicators (KPIs) are quantitative parameters, i.e., numbers filtering out the key information from a flood of data. For example, you can use KPIs to assess and evaluate the current status and development of a project or an entire company.

As the name implies, these indicators are the critical (key) indicators of progress toward a specific objective. Key performance indicators are used as an analytical basis for decision-making.

Types of KPIs

A distinction is made between absolute and relative key performance indicators. KPIs can be quantitative or qualitative. Qualitative KPIs (e.g., customer satisfaction) do not use numbers.

KPI Examples

KPIs used in project and portfolio management are, for example:

  • CPI (Cost Efficiency)
  • Total Costs
  • SPI (Time Efficiency)
  • Average Duration
  • Average Time Variance

Learn how to calculate the CPI and SPI in our article: Earned Value Explained.

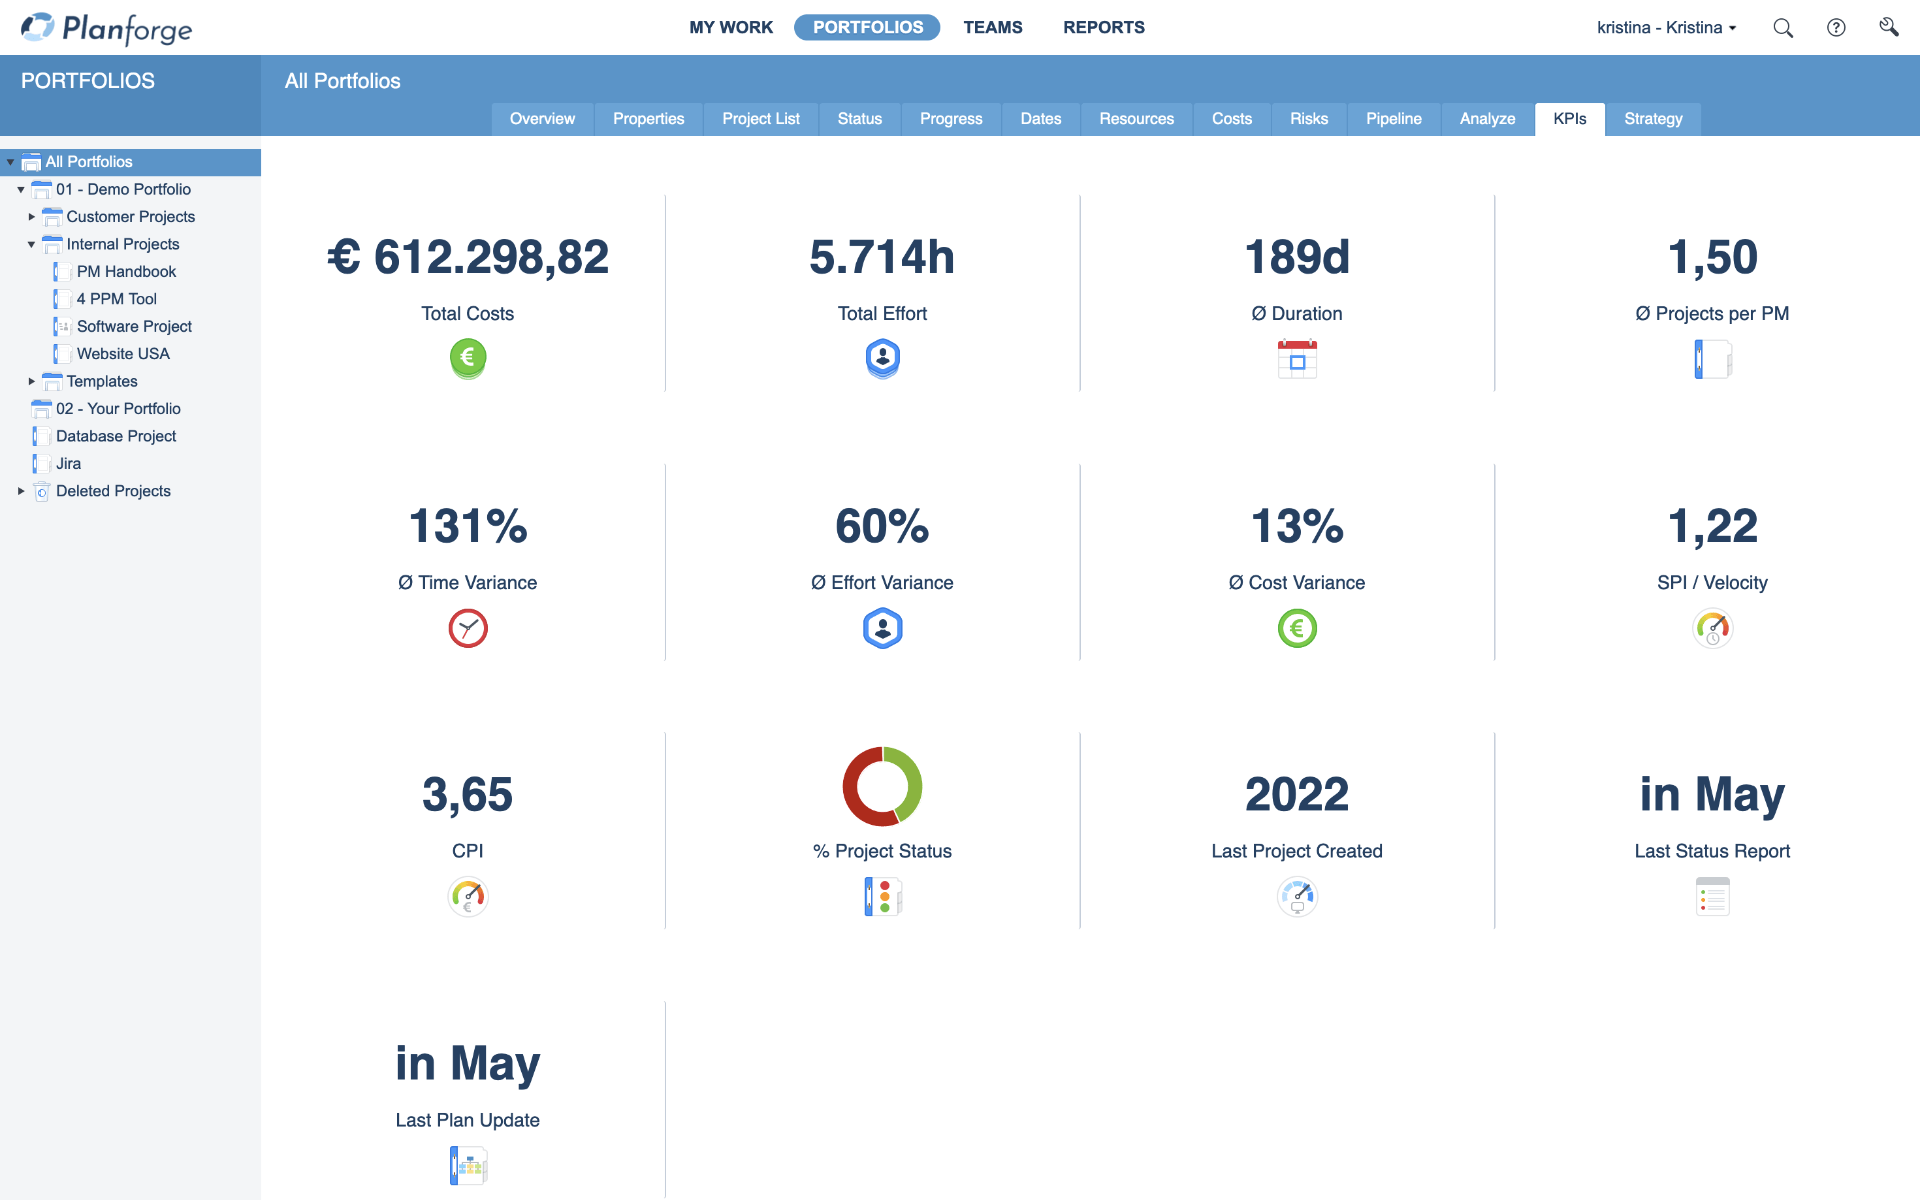
The following figure displays real-time key performance indicators in project management software:

Portfolio management key performance indicators software by Planforge

Gerald Aquila

Gerald Aquila

175 words • 2 minutes

Share on: Auf LinkedIn teilen Tweet Auf Facebook teilen

Related Articles

Earned Value Analysis as an Efficient Project Controlling Tool

How efficiently are you using your time and resources? Learn how to properly use the concept of Earned Value in project management: Explanation and calculation of important project controlling key figures to compare the project plan and actual status.

Read more

Read more

Planforge Blog
Software
  • Project Management
  • Portfolio Management
  • Program Management
  • Resource Management
  • Strategic Management
  • Enterprise Agile Planning
Solutions
  • Project Management Office
  • Lean Project Management
  • New Product Development
Integrations
  • API
  • Jira
  • Confluence
  • SAP
Experience
  • References
  • Success Stories
All about Planforge
  • Company
  • Partners
  • Jobs
  • News
  • Press
ONEPOINT Projects GmbH

Dietrich-Keller-Strasse 24/6
8074 Raaba-Grambach (Graz), Austria
+43 (316) 267 267 0

ONEPOINT Germany

Mühlenstrasse 13
85778 Haimhausen (Munich), Germany
+49 (81) 33 444 777

ONEPOINT USA

325 W. Washington St. #2225
San Diego, CA 92103, USA
+1 (619) 985 0673

© 2023 ONEPOINT Projects GmbH   info@planforge.io   Imprint   Privacy

li fb o yt tw